What can be concluded from the following graph? - ProProfs Discuss
Advertisement

What can be concluded from the following graph?

The graph below shows the changes in the size of the populations of two different species of paramecia placed in one beaker.

Asked by Wyatt Williams, Last updated: Apr 23, 2024

+ Answer
Request
Question menu
Vote up Vote down

2 Answers

Markda John

Markda John

Markda John
Markda John

Answered Apr 02, 2018

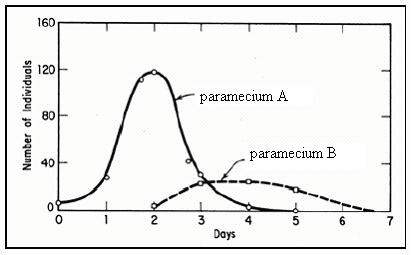
This graph shows that paramecium B is the predator, and paramecium A is the prey. So, to figure this out, you have to look at two things: the populations, and when each paramecium was introduced to the beaker. Paramecium A is introduced at day 0. There’s a huge peak in the population of this paramecium over the next two days. Paramecium B is added on day 2.

Paramecium A’s population plummets over the next three days as paramecium B’s population slowly grows. By day 5, there’s no paramecium A left. Paramecium B survives for another day and a half before dying off. The only way this kind of graph could come around would be if paramecium B is eating paramecium A.

upvote downvote
Reply 

Wyatt Williams

Wyatt Williams

Wyatt Williams
Wyatt Williams

Answered Oct 10, 2017

The introduction of paramecium B is followed by a decline in the population of paramecium A
upvote downvote
Reply 

Advertisement
Advertisement
Search for Google images Google Image Icon
Select a recommended image
Upload from your computer Loader
Image Preview
Search for Google images Google Image Icon
Select a recommended image
Upload from your computer Loader
Image Preview
Search for Google images Google Image Icon
Select a recommended image
Upload from your computer Loader

Email Sent
We have sent an email to your address "" with instructions to reset your password.